gghm() for long format data.
Usage
gghm_tidy(
  x,
  rows,
  cols,
  values,
  labels = NULL,
  annot_rows = NULL,
  annot_cols = NULL,
  facet_rows = NULL,
  facet_cols = NULL,
  ...
)
Arguments
- x
Data frame containing data to plot.
- rows, cols, values
Columns to use as rows, columns, and cell values.
- labels
Column to use for cell labels. NULL (default) for no labels.
- annot_rows, annot_cols
Columns to use for row and column annotations.
- facet_rows, facet_cols
Columns to use for row/column facet memberships.
- ...
Additional arguments for
gghm().
Examples
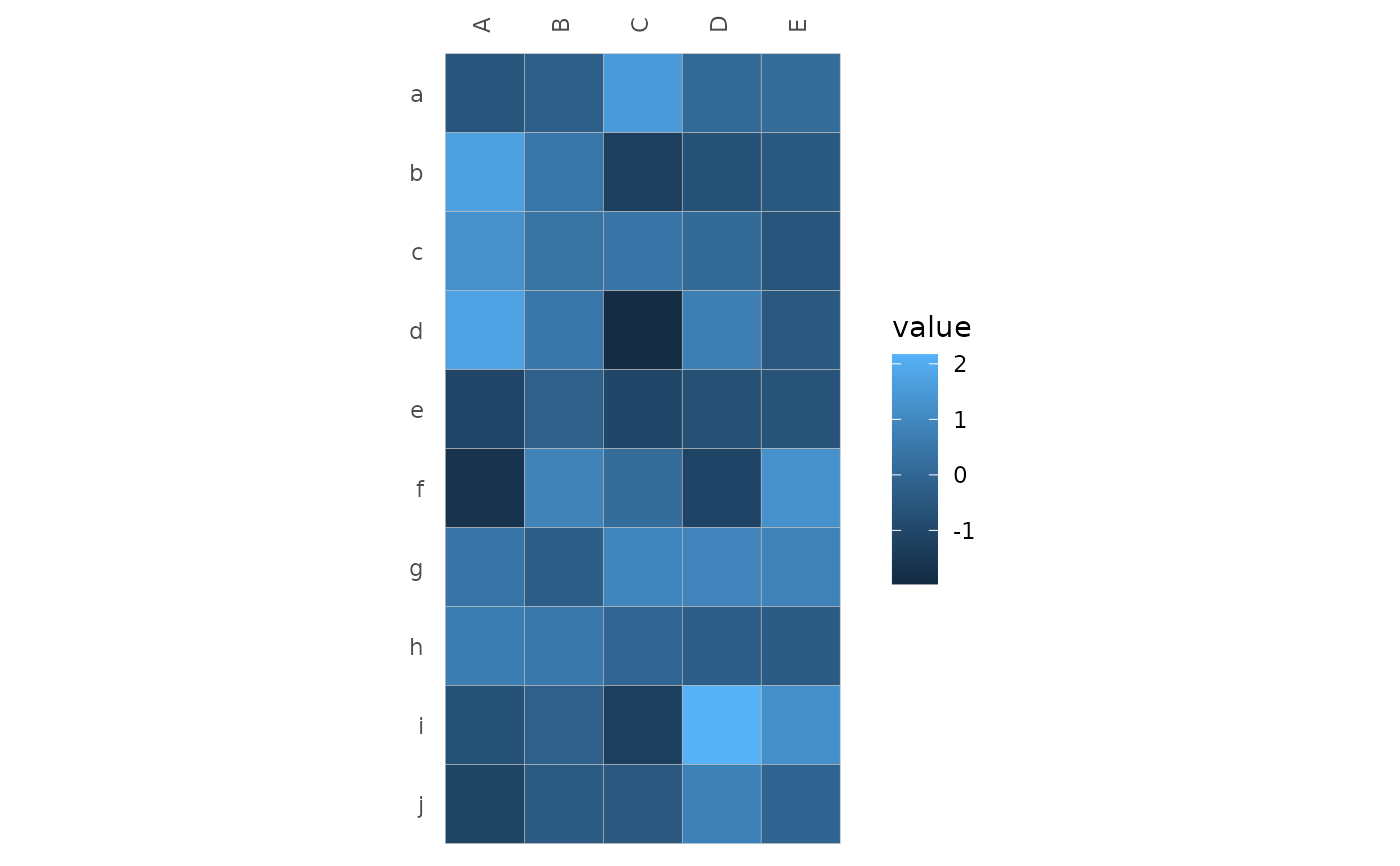
# Basic example
set.seed(123)
hm_in <- data.frame(row = rep(letters[1:10], each = 5),
col = rep(LETTERS[1:5], 10),
val = rnorm(50))
gghm_tidy(hm_in, row, col, val)
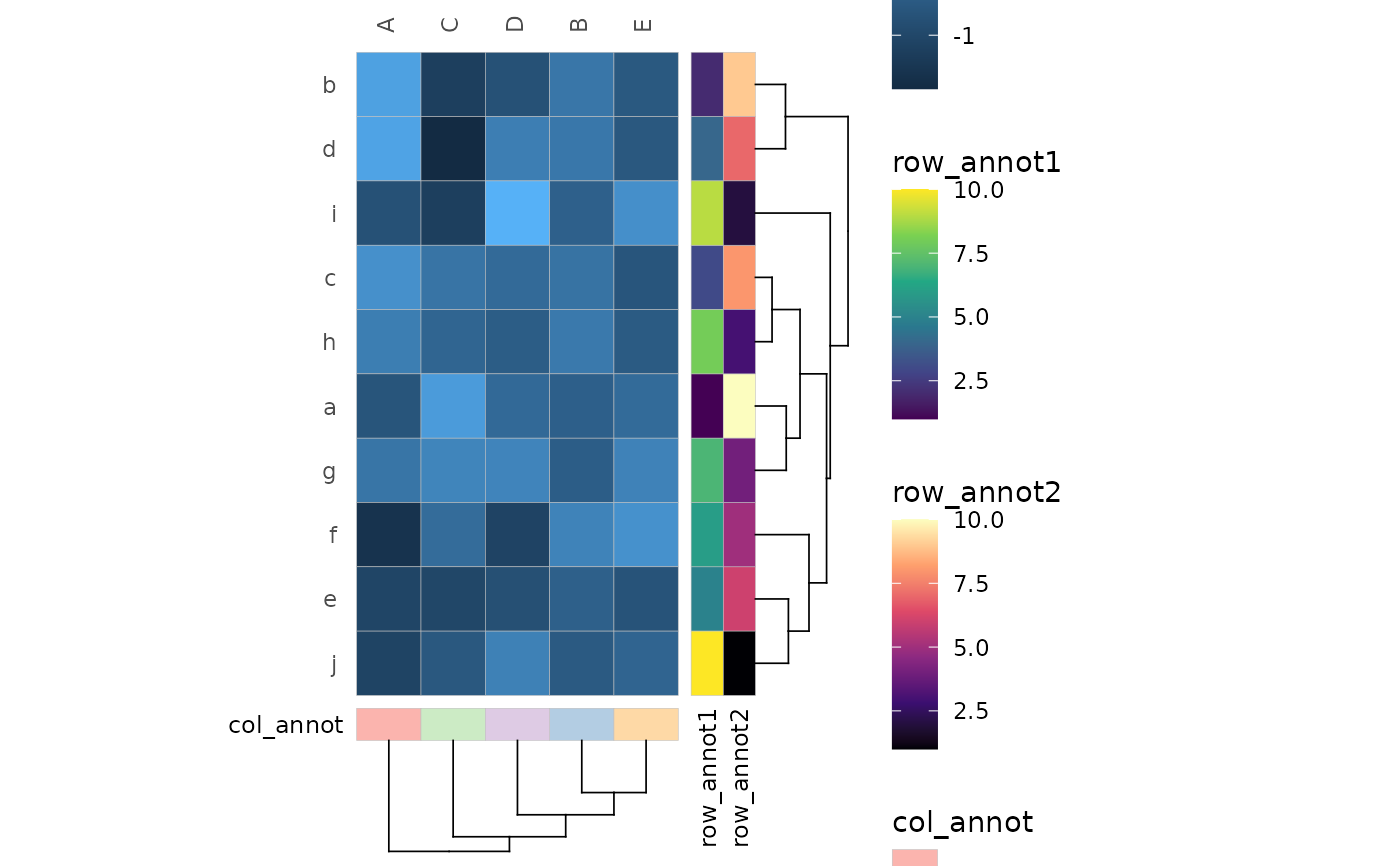
 # Annotation and clustering
# Add annotation by giving names of columns in the data
hm_in$row_annot1 <- rep(1:10, each = 5)
hm_in$row_annot2 <- rep(10:1, each = 5)
hm_in$col_annot <- rep(letters[1:5], 10)
# Columns are given using 'tidy' selection
# so they can be unquoted, quoted, from variables (with !! notation) or indices
gghm_tidy(hm_in, row, col, val,
annot_rows = c(row_annot1, row_annot2),
annot_cols = col_annot,
cluster_rows = TRUE,
cluster_cols = TRUE)
# Annotation and clustering
# Add annotation by giving names of columns in the data
hm_in$row_annot1 <- rep(1:10, each = 5)
hm_in$row_annot2 <- rep(10:1, each = 5)
hm_in$col_annot <- rep(letters[1:5], 10)
# Columns are given using 'tidy' selection
# so they can be unquoted, quoted, from variables (with !! notation) or indices
gghm_tidy(hm_in, row, col, val,
annot_rows = c(row_annot1, row_annot2),
annot_cols = col_annot,
cluster_rows = TRUE,
cluster_cols = TRUE)
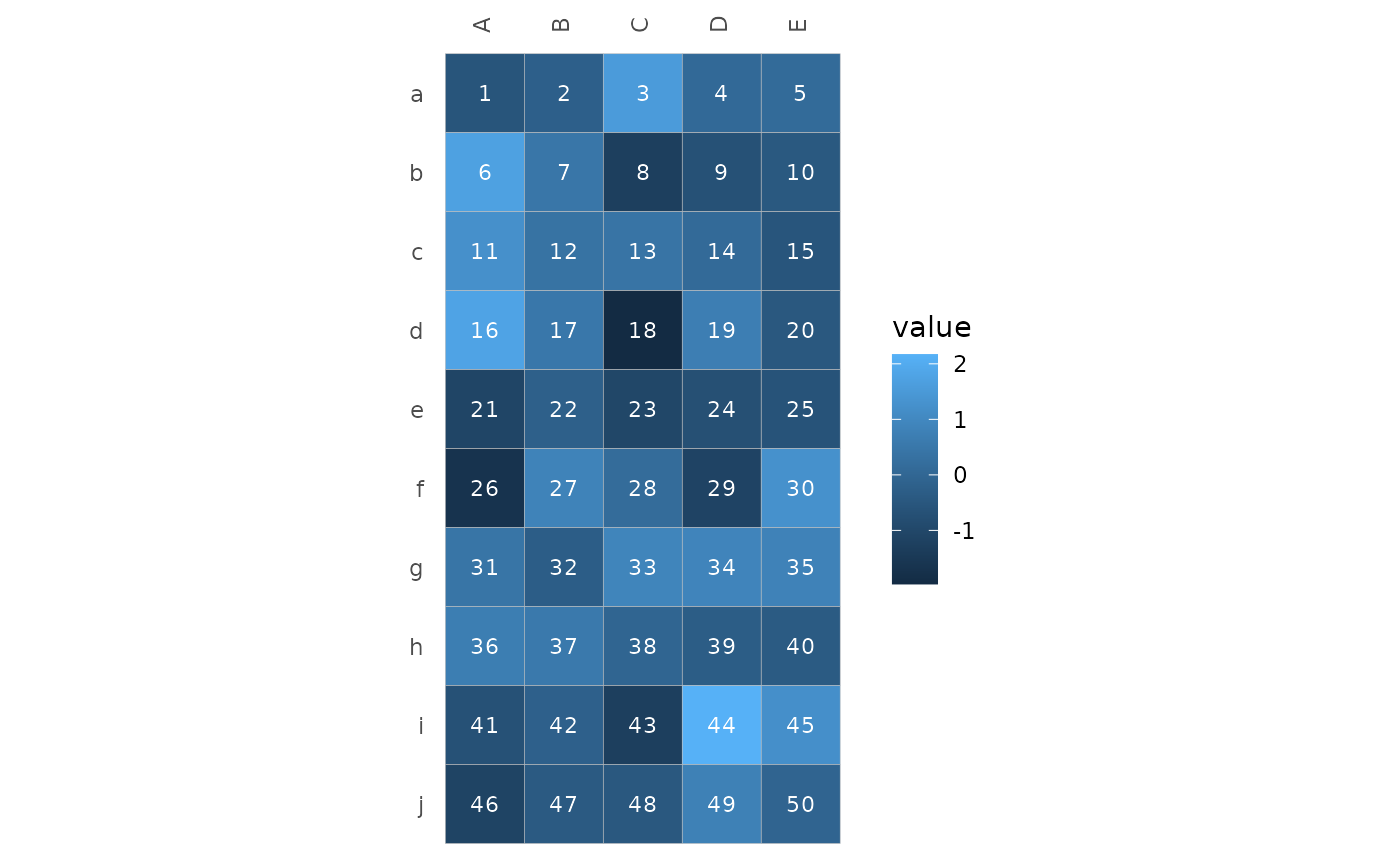
 # Add cell labels
hm_in$lab <- 1:50
gghm_tidy(hm_in, row, col, val,
labels = lab, cell_label_col = "white")
# Add cell labels
hm_in$lab <- 1:50
gghm_tidy(hm_in, row, col, val,
labels = lab, cell_label_col = "white")